Applied Bayesian Data Analysis
Model checking
Concepts:
- posterior predictive checking
- test quantity, p-value
- marginal checking, cross validation
- sensitive analysis
Model checking in Bayesian data analysis
- Is the model adequate?
- Where is the problem?
- prior
- sampling
- hierarchical structure
Sensitivity analysis and model improvement
- How does the posterior change
- A model may be adequate but sensitive
Is our model true or false?- Is the model good enough for our use?
Does the inference result make sense?
- Is important knowledge omitted from the model?
- External validation
- Choice of predictive quantities
External validation
- New data to check the model.
- Example: Michael Levitt and Corona
Choosing predictive quantities
- Analysis depends on what we predict.
- In hierarchical model we can predict (school, rats):
- Either new group
- Or new items in existing groups
Posterior predictive checking
Our models are generative
- Draw samples from predictive posterior.
- Compare the draws to the data.
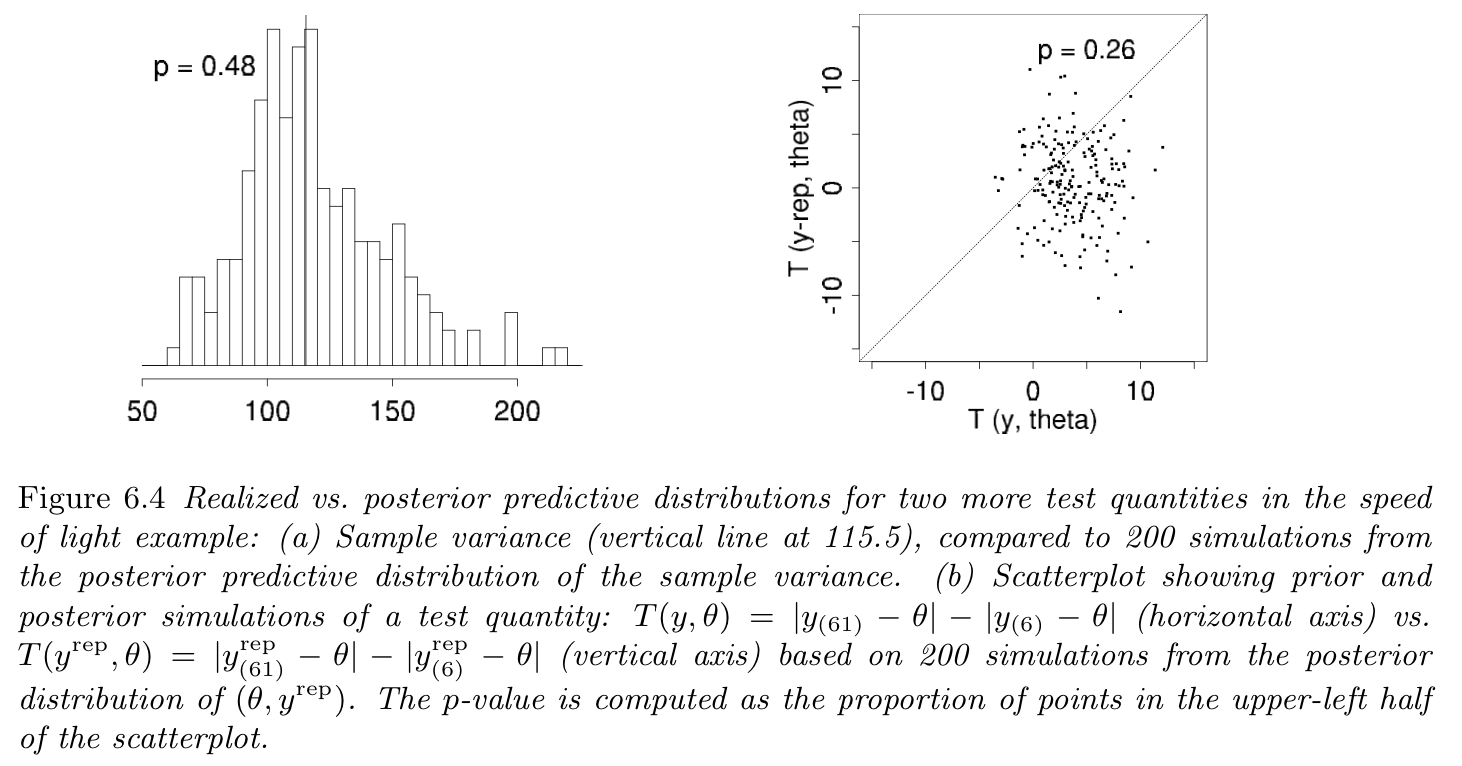
Example: Newcomb's speed of light
Notation for replications
- Replicated data: $y^{\mathrm{rep}}$
- Same explanatory variables $x$ as in $y$
- Posterior predictive of $y^{\mathrm{rep}}$: $$p(y^{\mathrm{rep}}|y)=\int p(y^{\mathrm{rep}}|\theta)p(\theta|y)d\theta$$
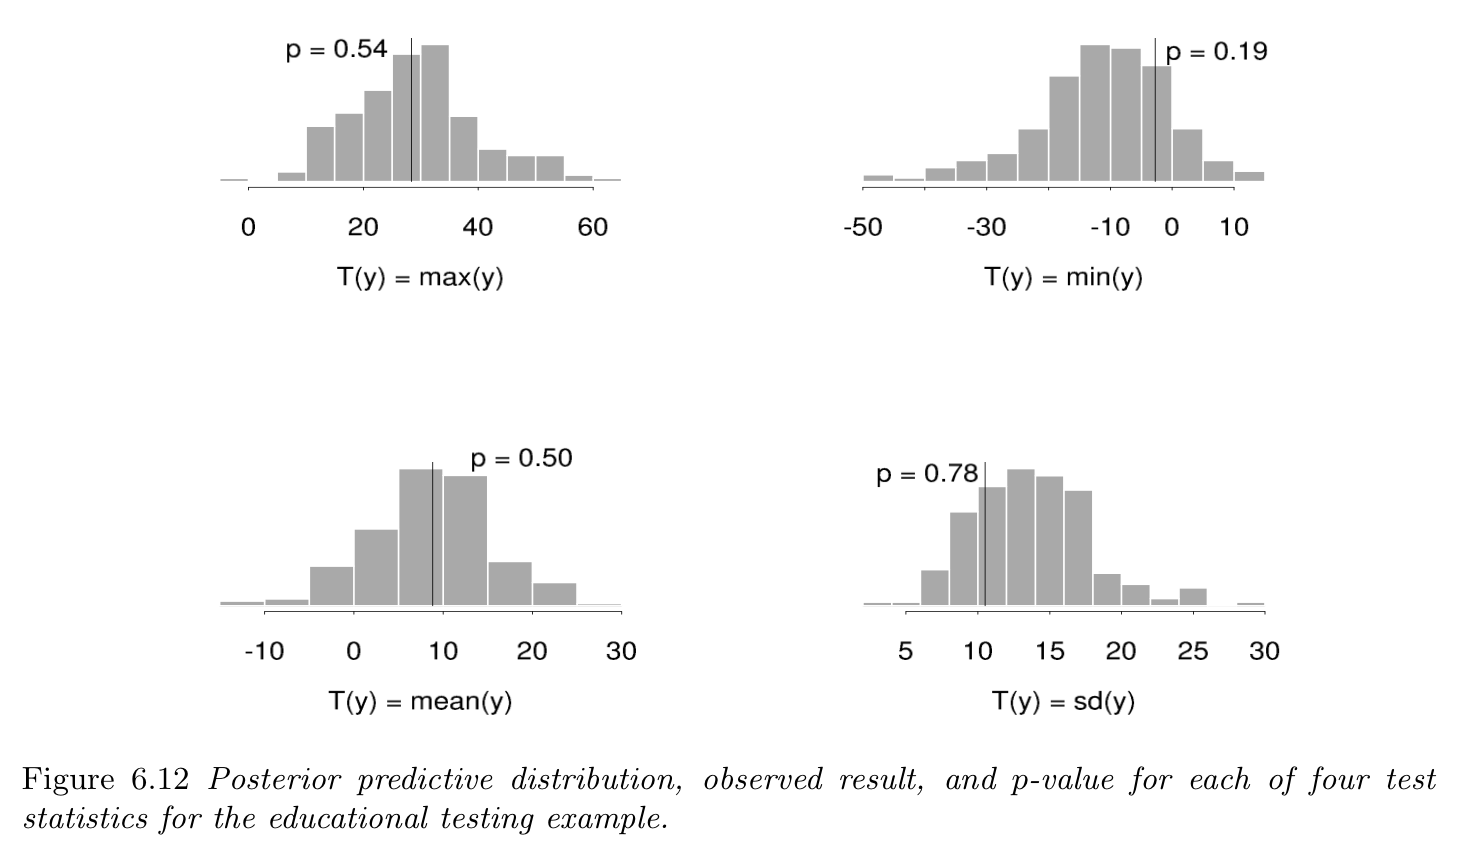
Test quantities
- discrepancy measures — aspects of the data we want to check
- $T(y, \theta)$ or $T(y^{\mathrm{rep}}, \theta)$
- Posterior predictive p-values — $$p_{B}=\Pr(T(y^{\mathrm{rep}}, \theta) \ge T(y, \theta)|y)$$
- In practice, use simulation to compute $y^{\mathrm{rep}}$ and $p_{B}$
Test quantities
Choosing test quantities
- Should depend on data `more' than on parameters
- Can use several test quantities for different aspects
Example: globe tosses
Interpreting p-values
- Quantifying discrepancies between data and model
- Limitations of posterior tests:
- Adequate model can be bad ($\tau = 0$)
- `Bad' model can work in some cases
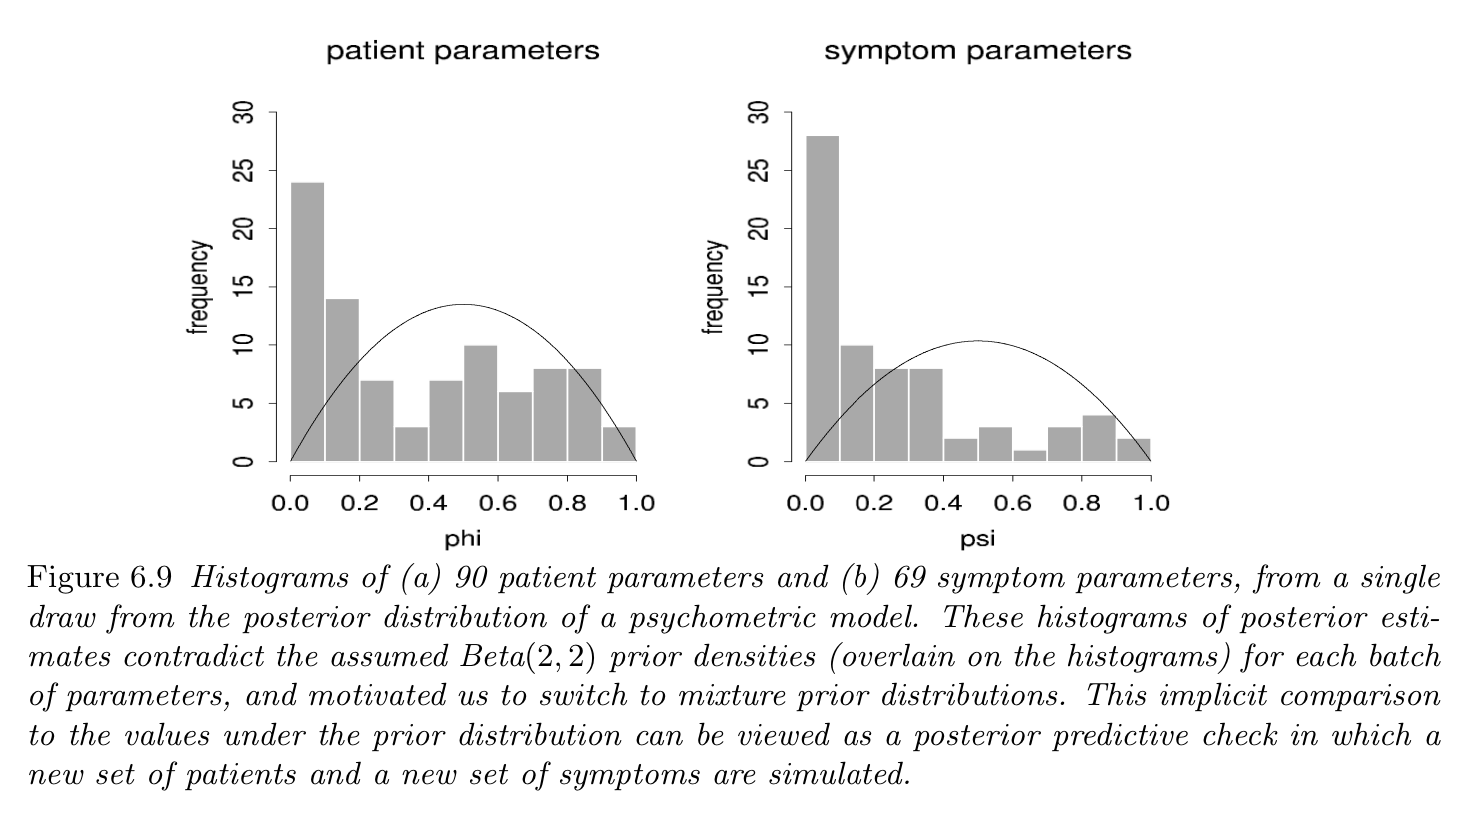
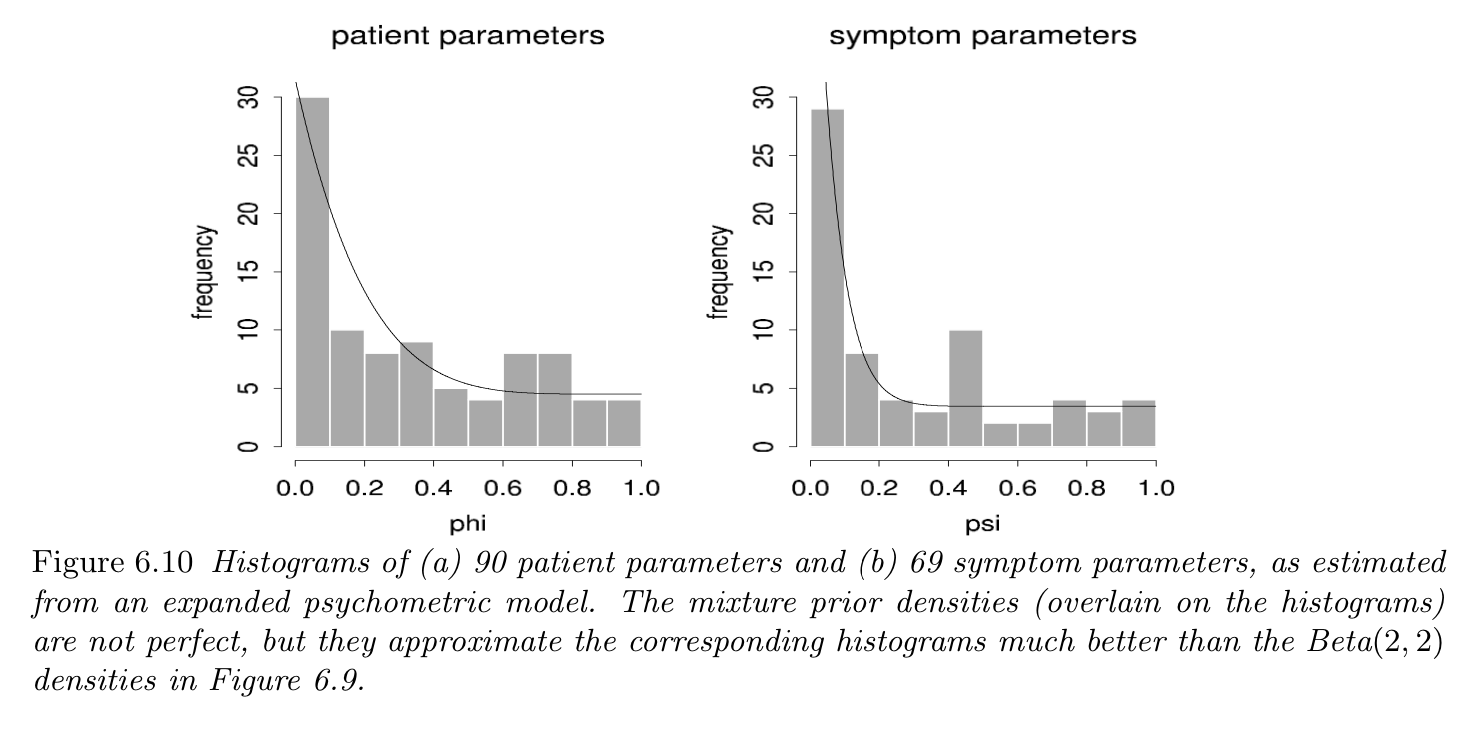
Marginal predictive checks
- Compute for each $y_i$: $$p_i = \Pr(T(y_i^{\mathrm{rep}}) \le T(y_i)|y)$$
- Sometimes, best $T(y)$ is $T(y) = y$: $$p_i = \Pr(y_i^{\mathrm{rep}} \le y_i|y)$$
-
Example — 8 schools:
- Marginal for each existing school
- Margin for a new school
- Cross validation: $$p_i = \Pr(y_i^{\mathrm{rep}} \le y_i|y_{-i})$$
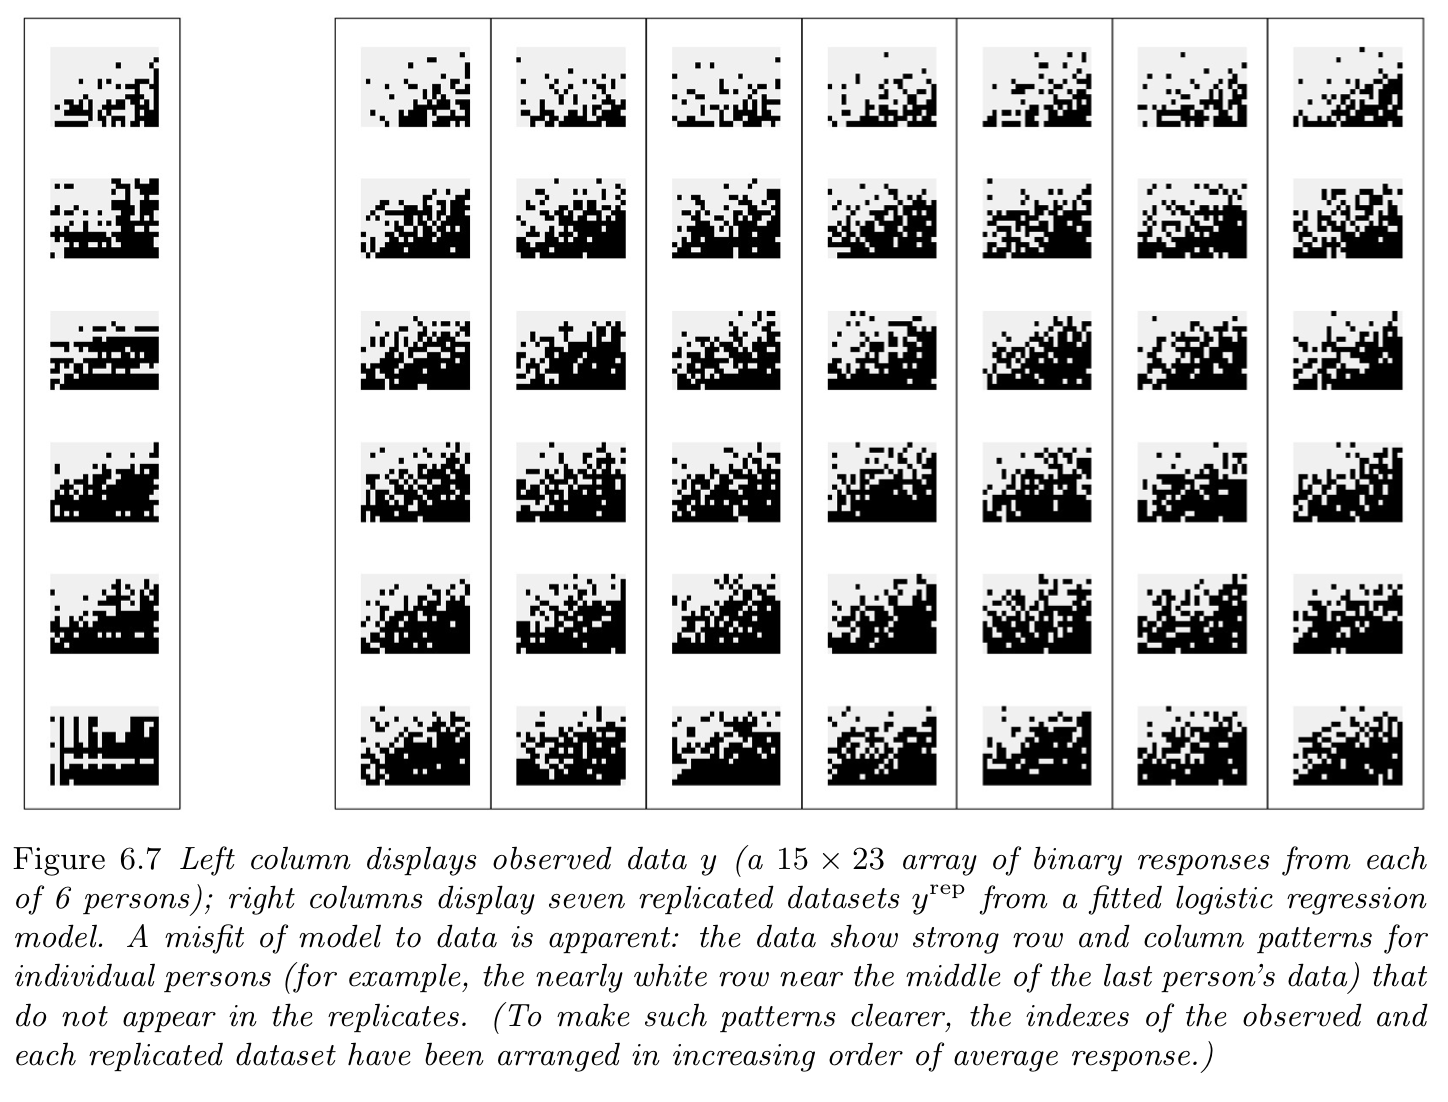
Graphical posterior predictive checks
- Direct data display
- Summary statistics
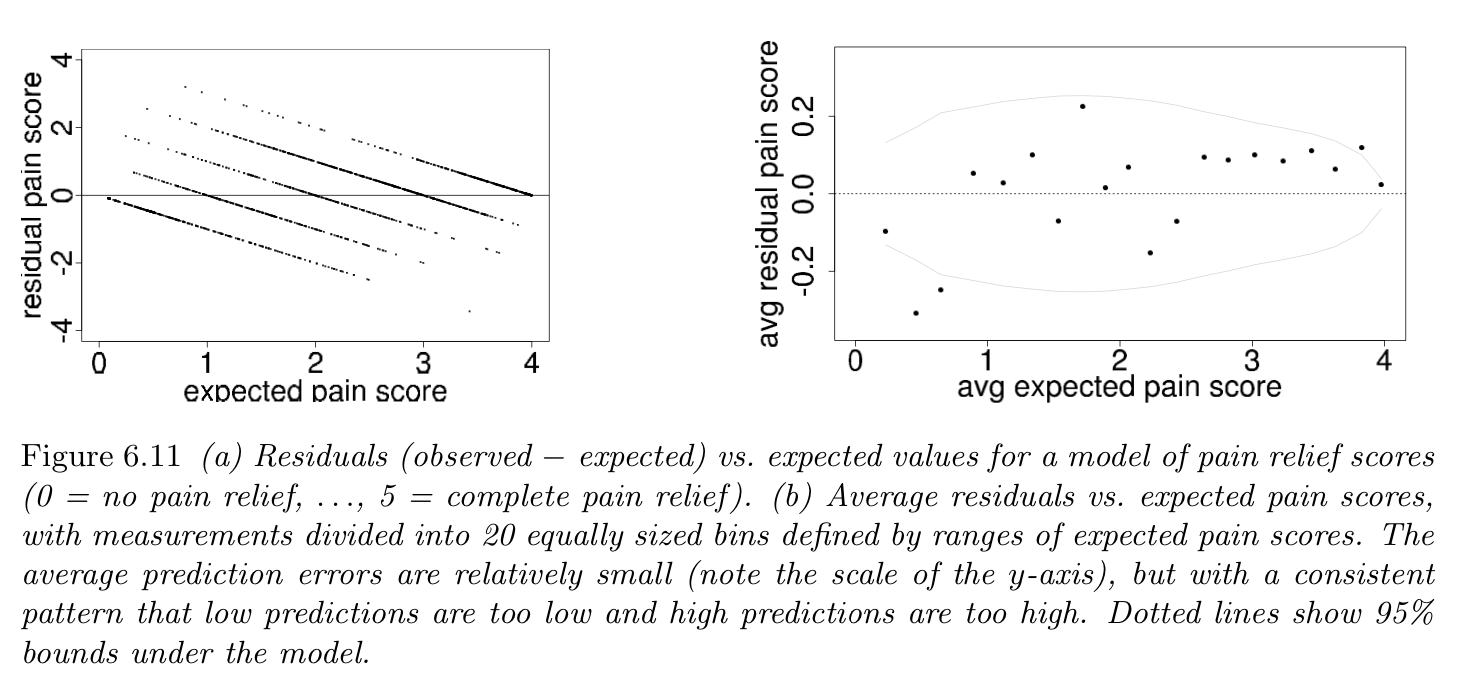
- Residuals
Direct data display
Summary statistics
Summary statistics
Residuals
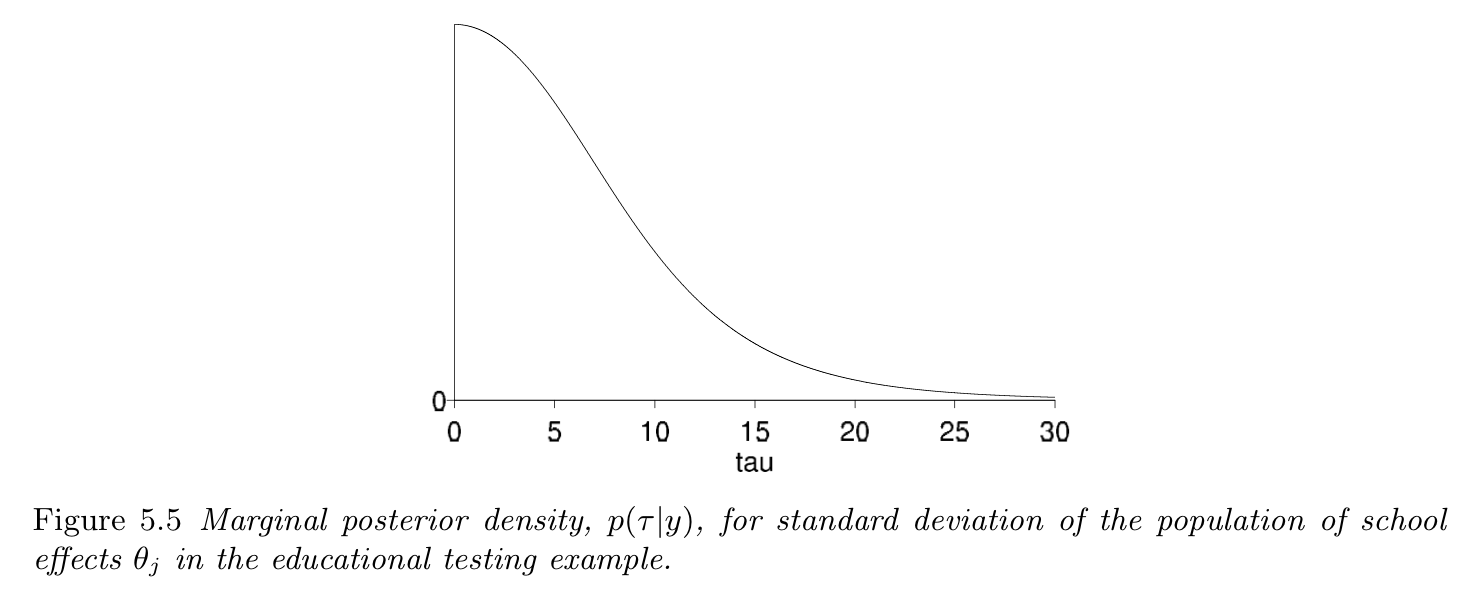
Model checking on 8 schools
Assumptions:
- $y_j \sim \mathcal{N}(\theta_j, \sigma_j)$
- $\theta_j$ exchangeable
- (?) $\theta_j \sim \mathcal{N}(\mu, \tau)$
- (?) $p(\mu, \tau) = C$
Posterior predictive checking
Sensitivity analysis
Readings
- Bayesian Data Analysis — chapter 6.
- Statistical rethinking — section 3.2.2.
- Probabilistic Models of Cognition — chapter 7, section ‘Posterior prediction and model checking’.
Hands-on
- Speed of light
- Globe toss